clay minerals
High-quality mineralogic analyses and interpretations in terms of:
sedimentation and tectonics events, hydrocarbon generation, acumulation, migration and expulsion, reservoir Quality prediction
CLAY MINERALOGY
Types of analyses
XRF analyses:
An XRF spectrometer is used for routine chemical analyses of rocks, minerals, sediments, and fluids. In the present study, the formation rock samples were crushed and ground to approximately 5 micron particle size, and then made into pressed pellets using binder for XRF measurement: measured XRF using energy dispersive XRF spectrophotometer. The concentration of elements was determined against the standard calibration curve and reported in their respective oxide form.
XRF provides an elemental concentration of samples, and mineralogical composition can be determined based on theoretical calculation. However, it cannot discriminate between the minerals having the same chemical composition but different crystalline structure (e.g., calcite, vaterite, and aragonite).
XRD analyses:
XRD is normally used to determine mineralogy of reservoir rocks. Few grams of specimen were crushed, ground, and passed through 200- mesh sieves to attain uniform grain size particles. A powdered sample was scanned between 2 to 80 theta under X-ray to obtain the diffraction pattern to semi-quantify the mineralogical composition. Each peak on acquired XRD spectrum corresponds to a particular mineral and was analyzed using the ICCD library, whereas relative abundance of each mineral was determined by relative intensity ratio. Shale samples containing a significant quantity of clay can be further analyzed by XRD analysis of a glycolated slide to determine each clay fraction, such as illite, smectite, kaolinite, and chlorite.
Formation samples containing swelling clay when titrated with methylene blue readily adsorbs methylene blue dye because of the cation exchange capacity phenomena. Determination of cation exchange capacity of formation provides information about their reactivity to water and estimation of swelling clay concentration. In the present study, methylene blue testing was also performed to determine the cation exchange capacity of formation samples.
XRD provides information about the crystalline material only. Amorphous material does not provide XRD patterns and is not detectable using XRD.
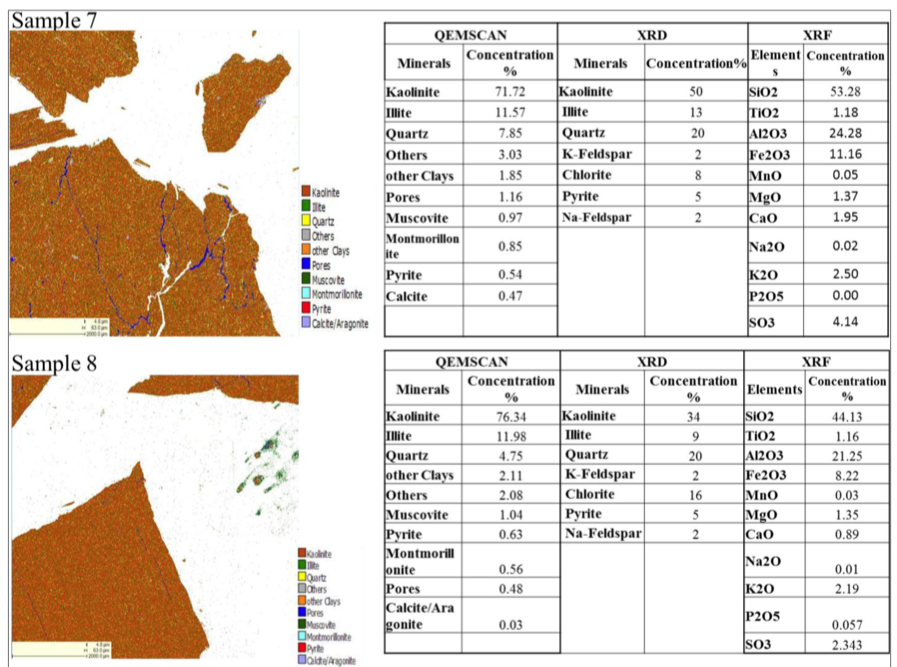
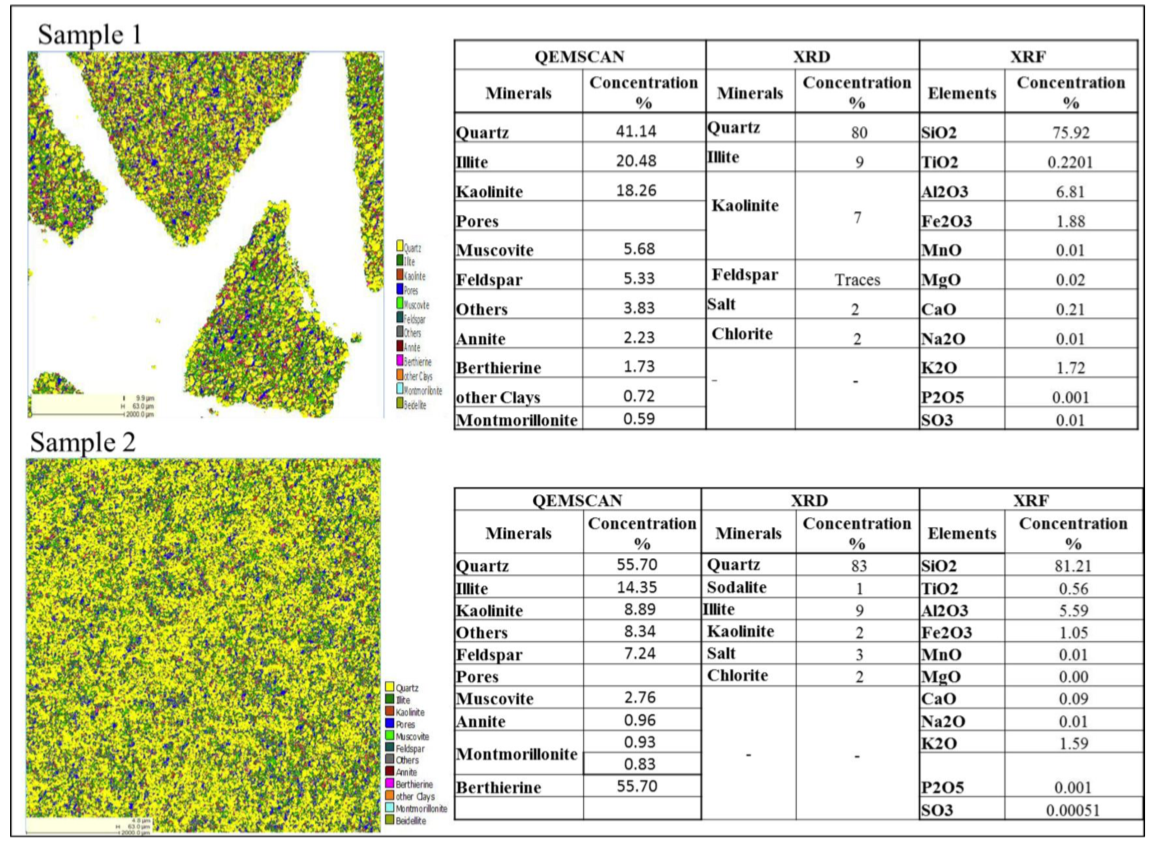
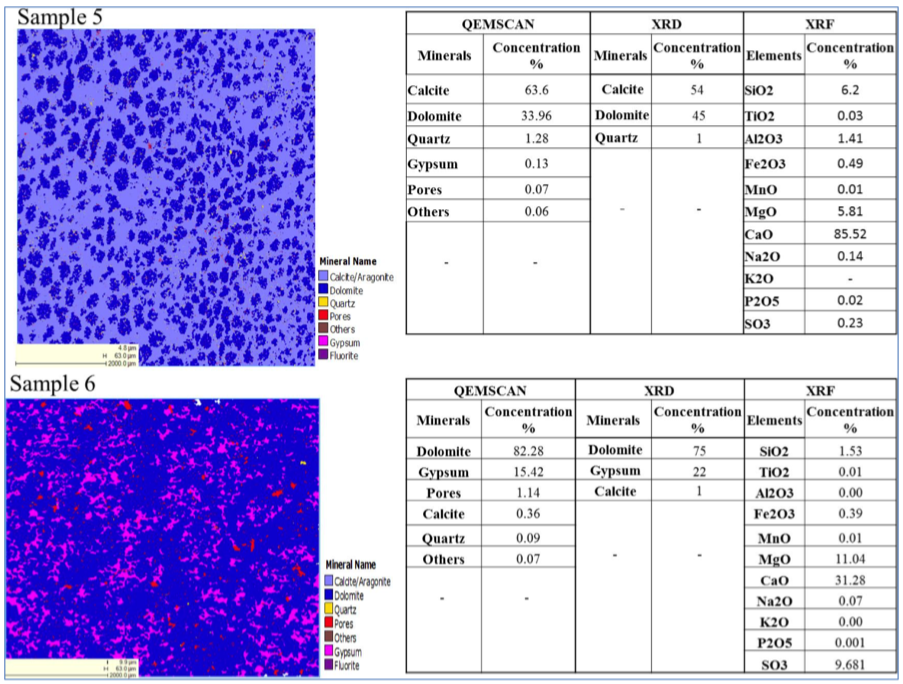
QEMSCAN analyses :
QEMSCAN is a highly sophisticated state-of-the-art machine used to scan the rock sample and acquire photo-micro-images. These photo- micro-images are framed together and stitched to form a mosaic that represents the entire rock-sample’s surface. Individual pixels of photomicrographs provide elemental information, which is represented by means of spectrum used to derive minerals, along with spatial distribution within the unit area of study (i.e., mineral distribution map). Each pixel is color-coded to display the elemental and mineral distribution.
QEMSCAN helps identify mineralogical mapping, pore percentage, and grain-size distribution. Geospatial distribution of each and every mineral in each individual rock type can be represented by means of color-coding.
CLAY MINERALOGY
Exemple of results
Quartz-rich sample exhibiting significant clay content
Carbonate-rich sample
Clay-rich sample